




SEJournal Online is the digital news magazine of the Society of Environmental Journalists. Learn more about SEJournal Online, including submission, subscription and advertising information.
September 30, 2026
 |
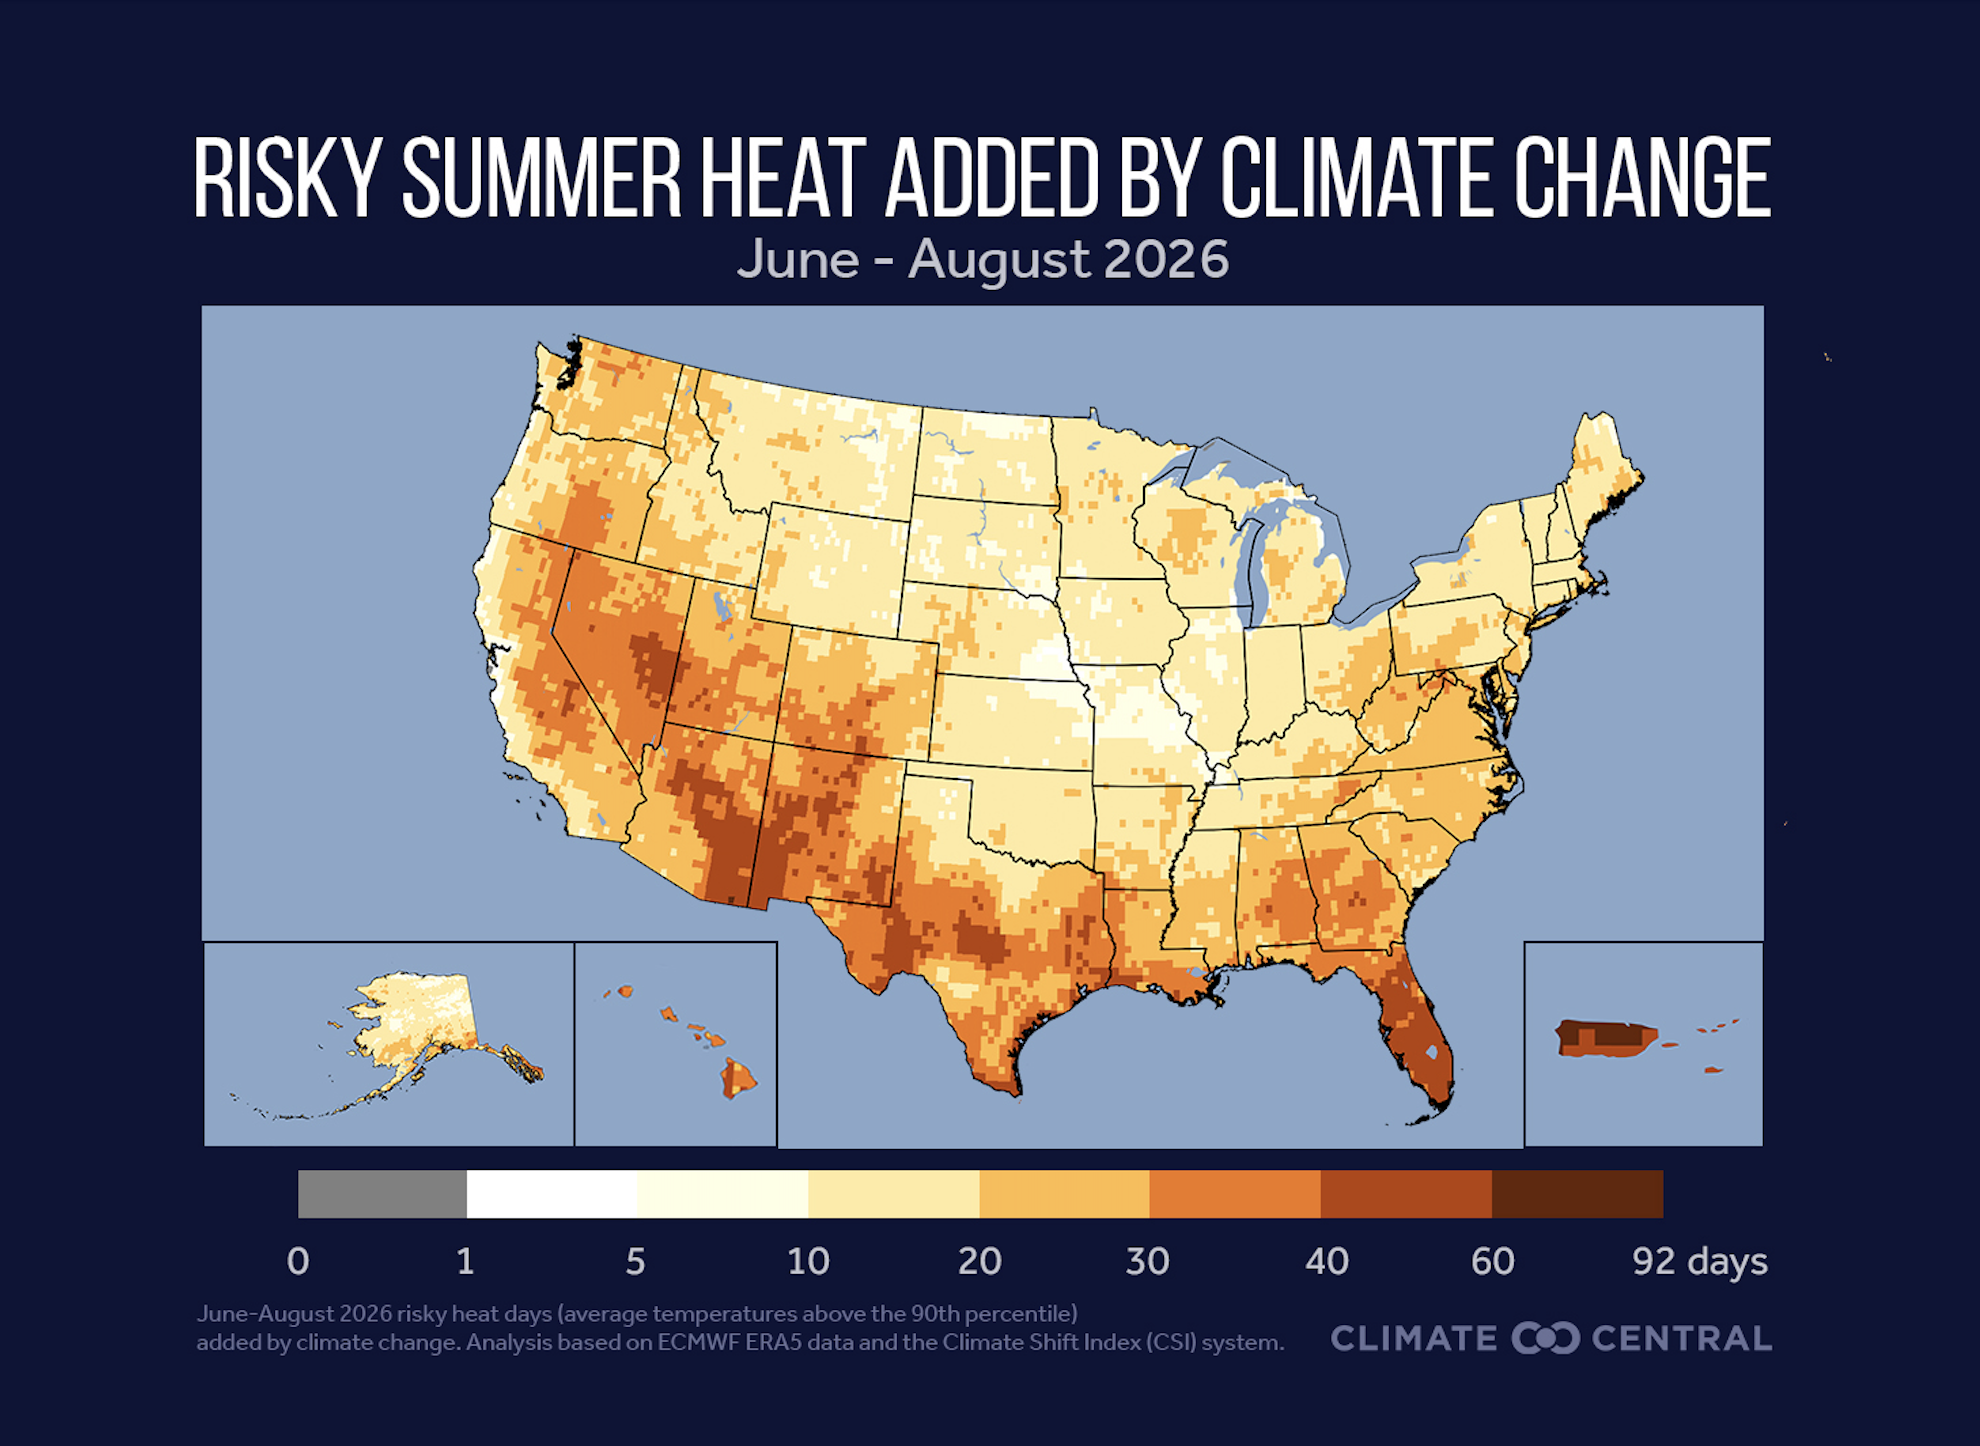 |
| Agencies that report heat deaths typically only count the obvious cases, even though they often take other forms. Above, risky heat days added by climate change during June-August 2026. Image: Climate Central (CC BY 4.0). |
TipSheet: Counting Heat Deaths When Official Data Is Deceptive
By Joseph A. Davis
Summer’s over. It’s time to count the bodies.
At least that’s what many environmental journalists covering the human impacts of climate change want to do. Problem is: They are way undercounted.
It matters, of course, because we don’t want our friends, family and fellow humans to die.
Truly accurate numbers are
hard to get. That means
we are not seeing the true
impact of climate change.
It also matters because truly accurate numbers are hard to get. That means we are not seeing the true impact of climate change.
And that will lull many of us into complacency about the drastic measures needed to address it. And because it is the job of environmental journalists to find the facts and tell people.
The backstory
Historically, we have regarded waves of heat deaths as rare. Chicago had a nasty heat wave in July 1995 that made headlines because 739 people died from it. Many of them were elderly living alone without air conditioning, or infants, who were especially vulnerable.
That was then. It’s hotter now.
The latest news is a skillful report from the team at NPR. They did a lot of the work so you don’t have to. But you can do an even more locally customized look with a few tips from the experts.
NPR found that heat deaths are undercounted and explained the reasons why. To put it simply, the agencies that report heat deaths to the Centers for Disease Control and Prevention (the official counter) only count the obvious ones, where it may say “heat stroke” on the death certificate.
Heat deaths often take other forms,
like heart attacks. So NPR used the
‘excess deaths’ methodology to
get more accurate results.
But heat deaths often take other forms, like heart attacks. So NPR used the “excess deaths” methodology to get more accurate results.
This method starts with death data for a period of comparable length and timing to the one under examination — but of “normal” temperature. That number of deaths is then compared to the number for the abnormally hot period. The excess is closer to the number of deaths actually caused by heat.
Using the excess deaths method, NPR got much higher counts of heat deaths — five, 10 or even 30 times what was otherwise reported.
Sadly, it did not offer a do-it-yourself gizmo. Fortunately, you can do it yourself:
- Pick a newsy period of excess heat in an area of interest to you and your audience. Find what the CDC says about heat deaths during that time.
- Try to calculate excess deaths for that period. Use the CDC WONDER query engine.
Reporting resources
- Centers for Disease Control and Prevention: The CDC does collect heat death data — however accurate that data is. There’s a lot there. It’s the agency trying to track death from heat or other causes (not the Census Bureau, which tracks live people). A good entry into its statistics is its data tracker app, called Data Explorer.
- American Public Health Association: A professional association of health experts. It finds heat deaths to be higher using the excess deaths method.
- World Health Organization: A UN-affiliated group of public health professionals from nations around the world.
- State and local health departments: These are the agencies that submit heat death data to the CDC. You can talk to them about your local situation. Find your own from this National Association of County and City Health Officials' directory or a CDC health department directory.
[Editor’s note: For more on extreme heat, see recent stories including a TipSheet on story ideas around extreme summer heat, an Issue Backgrounder on the El Niño phenomenon and a Feature on how attribution science can help reporters on the heat beat. Also see earlier accounts, such as a Feature on covering heat’s health impacts, #SEJ2025 Live coverage on four things to know about extreme heat and TipSheets on how heat affects recreation, what makes communities more survivable, heat as a local story, urban heat islands and heat-induced grid failures. Plus, check out Toolboxes on the HeatRisk data site and on other resources for tying temperature shifts to climate change, finding record temps and tracking data on heat deaths. Also see a Backgrounder on extreme heat and human health, a Feature on reporting on workers in a warming world and an EJ InSight on photographing heat waves. In addition, visit our Topic on the Beat page on climate change, including dozens of SEJournal stories, special reports and other resources, and keep track of the latest extreme heat-related headlines via EJToday.]
Joseph A. Davis is a freelance writer/editor in Washington, D.C. who has been writing about the environment since 1976. He writes SEJournal Online's TipSheet, Reporter's Toolbox and Issue Backgrounder, and curates SEJ's weekday news headlines service EJToday and @EJTodayNews. Davis also directs SEJ's Freedom of Information Project and writes the WatchDog opinion column.
* From the weekly news magazine SEJournal Online, Vol. 11, No. 34. Content from each new issue of SEJournal Online is available to the public via the SEJournal Online main page. Subscribe to the e-newsletter here. And see past issues of the SEJournal archived here.
SEJ Publication Types:
Topics on the Beat:
Region:
Visibility: